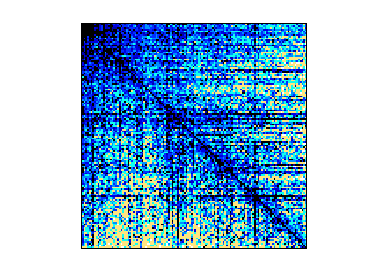
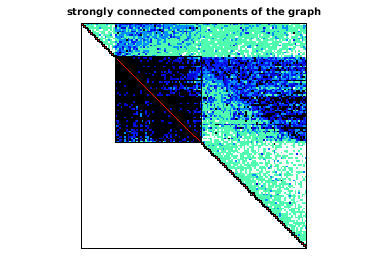
SNAP/sx-askubuntu
SNAP network: Ask Ubuntu temporal network
| Name |
sx-askubuntu |
| Group |
SNAP |
| Matrix ID |
2792 |
|
Num Rows
|
159,316 |
|
Num Cols
|
159,316 |
|
Nonzeros
|
596,933 |
|
Pattern Entries
|
596,933 |
|
Kind
|
Directed Temporal Multigraph |
|
Symmetric
|
No |
|
Date
|
2017 |
|
Author
|
A. Paranjape, A. R. Benson, and J. Leskovec |
|
Editor
|
J. Leskovec |
| Structural Rank |
|
| Structural Rank Full |
|
|
Num Dmperm Blocks
|
|
|
Strongly Connect Components
|
97,174 |
|
Num Explicit Zeros
|
0 |
|
Pattern Symmetry
|
32.7% |
|
Numeric Symmetry
|
18.5% |
|
Cholesky Candidate
|
no |
|
Positive Definite
|
no |
|
Type
|
integer |
| Download |
MATLAB
Rutherford Boeing
Matrix Market
|
| Notes |
SNAP (Stanford Network Analysis Platform) Large Network Dataset Collection,
Jure Leskovec and Anrej Krevl, http://snap.stanford.edu/data, June 2014.
email: jure at cs.stanford.edu

Ask Ubuntu temporal network

https://snap.stanford.edu/data/sx-askubuntu.html

Dataset information

This is a temporal network of interactions on the stack exchange web site
Ask Ubuntu (http://askubuntu.com/). There are three different types of
interactions represented by a directed edge (u, v, t):

user u answered user v's question at time t (in the graph sx-askubuntu-a2q)
user u commented on user v's question at time t (in the graph
sx-askubuntu-c2q) user u commented on user v's answer at time t (in the
graph sx-askubuntu-c2a)

The graph sx-askubuntu contains the union of these graphs. These graphs
were constructed from the Stack Exchange Data Dump. Node ID numbers
correspond to the 'OwnerUserId' tag in that data dump.

Dataset statistics (sx-askubuntu)
Nodes   159,316
Temporal Edges  964,437
Edges in static graph   596,933
Time span   2613 days

Dataset statistics (sx-askubuntu-a2q)
Nodes   137,517
Temporal Edges  280,102
Edges in static graph   262,106
Time span   2613 days

Dataset statistics (sx-askubuntu-c2q)
Nodes   79,155
Temporal Edges  327,513
Edges in static graph   198,852
Time span   2047 days

Dataset statistics (sx-askubuntu-c2a)
Nodes   75,555
Temporal Edges  356,822
Edges in static graph   178,210
Time span   2418 days

Source (citation)
Ashwin Paranjape, Austin R. Benson, and Jure Leskovec. "Motifs in Temporal
Networks." In Proceedings of the Tenth ACM International Conference on Web
Search and Data Mining, 2017.

Files
File    Description
sx-askubuntu.txt.gz All interactions
sx-askubuntu-a2q.txt.gz Answers to questions
sx-askubuntu-c2q.txt.gz Comments to questions
sx-askubuntu-c2a.txt.gz Comments to answers

Data format

    SRC DST UNIXTS

where edges are separated by a new line and

    SRC: id of the source node (a user)
    TGT: id of the target node (a user)
    UNIXTS: Unix timestamp (seconds since the epoch)

---------------------------------------------------------------------------
Notes on inclusion into the SuiteSparse Matrix Collection, July 2018:
---------------------------------------------------------------------------

The SNAP graph is 1-based, with nodes in all graphs numbered 1 to
n=515,280.

In the SuiteSparse Matrix Collection, the primary matrix, Problem.A, is
the overall static graph, with 596,993 edges, of size n-by-n with
n=159,316.  These edges represent the 964,437 temporal edges.  A(i,j) is
the number of times person u=nodeid(i) interacted with person v=nodeid(j),
with a temporal edge (u,v,t), with any kind of interaction.
Problem.aux.nodeid is a list of the node id's that appear in the SNAP data
set.

A2Q = Problem.aux.Q2A is the static sx-askubuntu-a2q graph.
C2Q = Problem.aux.C2Q is the static sx-askubuntu-c2q graph.
C2A = Problem.aux.C2A is the static sx-askubuntu-c2a graph.
These sum together to give the the overall graph.  That is,
A = A2Q + C2Q + C2A.

A2Q(u,v) is the number of times person u answered v's questions.
C2Q(u,v) is the number of times person u commented on v's question.
C2A(u,v) is the number of times person u commented on v's answer.

The temporal edges are held in:
Problem.aux.temporal_edges:     [964437x3]
Problem.aux.temporal_edges_a2q: [280102x3]
Problem.aux.temporal_edges_c2q: [327513x3]
Problem.aux.temporal_edges_c2a: [356822x3]

Each row in these matrices is a single temporal edge, (u,v,t).  Summing up
all entries in A gives 964,437, and likewise the sum of entries in the
other graphs gives the number of temporal edges they represent.
|

