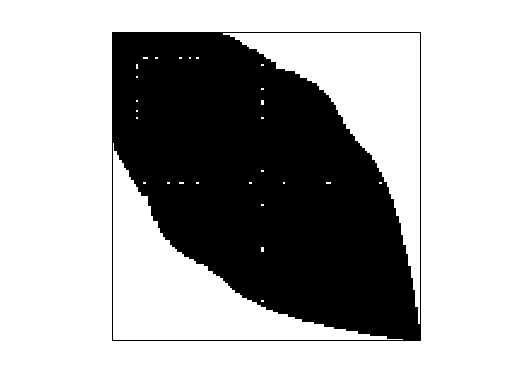
SNAP/as-Skitter
Internet topology graph, from traceroutes run daily in 2005
| Name |
as-Skitter |
| Group |
SNAP |
| Matrix ID |
2321 |
|
Num Rows
|
1,696,415 |
|
Num Cols
|
1,696,415 |
|
Nonzeros
|
22,190,596 |
|
Pattern Entries
|
22,190,596 |
|
Kind
|
Undirected Graph |
|
Symmetric
|
Yes |
|
Date
|
2005 |
|
Author
|
J. Leskovec, J. Kleinberg and C. Faloutsos |
|
Editor
|
J. Leskovec |
| Structural Rank |
|
| Structural Rank Full |
|
|
Num Dmperm Blocks
|
|
|
Strongly Connect Components
|
756 |
|
Num Explicit Zeros
|
0 |
|
Pattern Symmetry
|
100% |
|
Numeric Symmetry
|
100% |
|
Cholesky Candidate
|
no |
|
Positive Definite
|
no |
|
Type
|
binary |
| Download |
MATLAB
Rutherford Boeing
Matrix Market
|
| Notes |
Networks from SNAP (Stanford Network Analysis Platform) Network Data Sets,
Jure Leskovec http://snap.stanford.edu/data/index.html
email jure at cs.stanford.edu

Autonomous systems by Skitter

Dataset information

Internet topology graph. From traceroutes run daily in 2005 -
http://www.caida.org/tools/measurement/skitter. From several scattered sources
to million destinations. 1.7 million nodes, 11 million edges.

Dataset statistics
Nodes   1696415
Edges   11095298
Nodes in largest WCC    1694616 (0.999)
Edges in largest WCC    11094209 (1.000)
Nodes in largest SCC    1694616 (0.999)
Edges in largest SCC    11094209 (1.000)
Average clustering coefficient  0.2963
Number of triangles     28769868
Fraction of closed triangles    0.005387
Diameter (longest shortest path)    25
90-percentile effective diameter    5.9

Source (citation)

J. Leskovec, J. Kleinberg and C. Faloutsos. Graphs over Time: Densification
Laws, Shrinking Diameters and Possible Explanations. ACM SIGKDD International
Conference on Knowledge Discovery and Data Mining (KDD), 2005.

Files
File    Description
as-skitter.txt.gz   AS from traceroutes run daily in 2005 by skitter
|