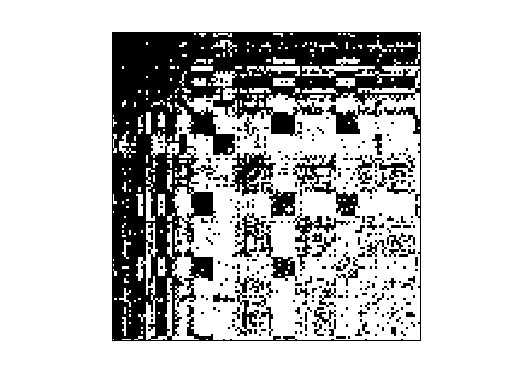
SNAP/Oregon-1
(9 graphs) AS peering info inferred from Oregon route-views, 3/31-5/26/01
| Name |
Oregon-1 |
| Group |
SNAP |
| Matrix ID |
2323 |
|
Num Rows
|
11,492 |
|
Num Cols
|
11,492 |
|
Nonzeros
|
46,818 |
|
Pattern Entries
|
46,818 |
|
Kind
|
Undirected Graph Sequence |
|
Symmetric
|
Yes |
|
Date
|
2001 |
|
Author
|
J. Leskovec, J. Kleinberg and C. Faloutsos |
|
Editor
|
J. Leskovec |
| Structural Rank |
|
| Structural Rank Full |
|
|
Num Dmperm Blocks
|
|
|
Strongly Connect Components
|
319 |
|
Num Explicit Zeros
|
0 |
|
Pattern Symmetry
|
100% |
|
Numeric Symmetry
|
100% |
|
Cholesky Candidate
|
no |
|
Positive Definite
|
no |
|
Type
|
binary |
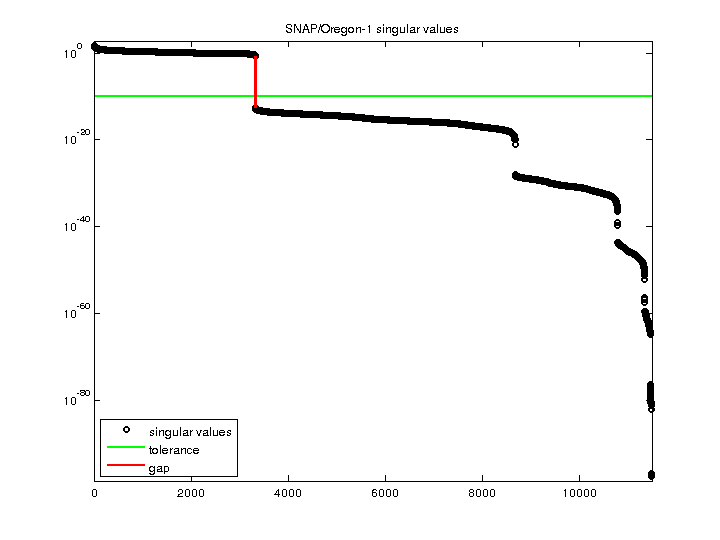
| SVD Statistics |
| Matrix Norm |
6.032764e+01 |
| Minimum Singular Value |
0 |
| Condition Number |
Inf
|
| Rank |
3,321 |
| sprank(A)-rank(A) |
|
| Null Space Dimension |
8,171 |
| Full Numerical Rank? |
no |
| Download Singular Values |
MATLAB
|
| Download |
MATLAB
Rutherford Boeing
Matrix Market
|
| Notes |
Networks from SNAP (Stanford Network Analysis Platform) Network Data Sets,
Jure Leskovec http://snap.stanford.edu/data/index.html
email jure at cs.stanford.edu

Autonomous systems - Oregon-1

Dataset information

9 graphs of Autonomous Systems (AS) peering information inferred from Oregon
route-views between March 31 2001 and May 26 2001.

Dataset statistics are calculated for the graph with the lowest (March 31 2001)
and highest (from May 26 2001) number of nodes: Dataset statistics for graph
witdh lowest number of nodes - 3 31 2001)

Nodes   10670
Edges   22002
Nodes in largest WCC    10670 (1.000)
Edges in largest WCC    22002 (1.000)
Nodes in largest SCC    10670 (1.000)
Edges in largest SCC    22002 (1.000)
Average clustering coefficient  0.4559
Number of triangles     17144
Fraction of closed triangles    0.009306
Diameter (longest shortest path)    9
90-percentile effective diameter    4.5

Dataset statistics for graph with highest number of nodes - 5 26 2001

Nodes   11174
Edges   23409
Nodes in largest WCC    11174 (1.000)
Edges in largest WCC    23409 (1.000)
Nodes in largest SCC    11174 (1.000)
Edges in largest SCC    23409 (1.000)
Average clustering coefficient  0.4532
Number of triangles     19894
Fraction of closed triangles    0.009636
Diameter (longest shortest path)    10
90-percentile effective diameter    4.4

Source (citation)

J. Leskovec, J. Kleinberg and C. Faloutsos. Graphs over Time: Densification
Laws, Shrinking Diameters and Possible Explanations. ACM SIGKDD International
Conference on Knowledge Discovery and Data Mining (KDD), 2005.

Files
File    Description
*        AS peering information inferred from Oregon route-views ...
oregon1_010331.txt.gz   from March 31 2001
oregon1_010407.txt.gz   from April 7 2001
oregon1_010414.txt.gz   from April 14 2001
oregon1_010421.txt.gz   from April 21 2001
oregon1_010428.txt.gz   from April 28 2001
oregon1_010505.txt.gz   from May 05 2001
oregon1_010512.txt.gz   from May 12 2001
oregon1_010519.txt.gz   from May 19 2001
oregon1_010526.txt.gz   from May 26 2001

NOTE: for the UF Sparse Matrix Collection, the primary matrix in this problem
set (Problem.A) is the last matrix in the sequence, oregon1_010526, from May 26
2001.

The nodes are uniform across all graphs in the sequence in the UF collection.
That is, nodes do not come and go.  A node that is "gone" simply has no edges.
This is to allow comparisons across each node in the graphs.
Problem.aux.nodenames gives the node numbers of the original problem.  So
row/column i in the matrix is always node number Problem.aux.nodenames(i) in
all the graphs.

Problem.aux.G{k} is the kth graph in the sequence.
Problem.aux.Gname(k,:) is the name of the kth graph.
|