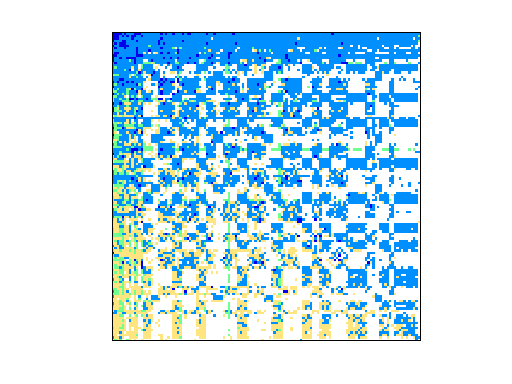
SNAP/as-caida
(122 graphs) CAIDA AS Relationships Datasets, from 1/04-11/07
| Name |
as-caida |
| Group |
SNAP |
| Matrix ID |
2322 |
|
Num Rows
|
31,379 |
|
Num Cols
|
31,379 |
|
Nonzeros
|
106,762 |
|
Pattern Entries
|
106,762 |
|
Kind
|
Directed Weighted Graph Sequence |
|
Symmetric
|
No |
|
Date
|
2007 |
|
Author
|
J. Leskovec, J. Kleinberg and C. Faloutsos |
|
Editor
|
J. Leskovec |
| Structural Rank |
|
| Structural Rank Full |
|
|
Num Dmperm Blocks
|
|
|
Strongly Connect Components
|
4,905 |
|
Num Explicit Zeros
|
0 |
|
Pattern Symmetry
|
100% |
|
Numeric Symmetry
|
7.9% |
|
Cholesky Candidate
|
no |
|
Positive Definite
|
no |
|
Type
|
integer |
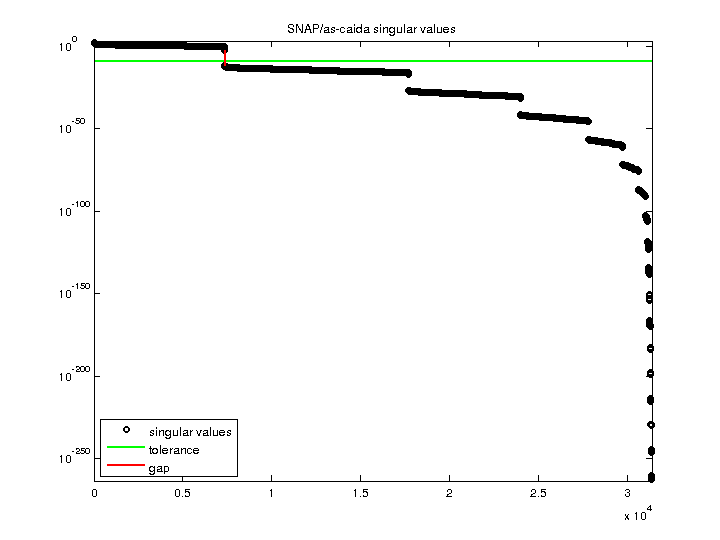
| SVD Statistics |
| Matrix Norm |
1.822487e+02 |
| Minimum Singular Value |
0 |
| Condition Number |
Inf
|
| Rank |
7,360 |
| sprank(A)-rank(A) |
|
| Null Space Dimension |
24,019 |
| Full Numerical Rank? |
no |
| Download Singular Values |
MATLAB
|
| Download |
MATLAB
Rutherford Boeing
Matrix Market
|
| Notes |
Networks from SNAP (Stanford Network Analysis Platform) Network Data Sets,
Jure Leskovec http://snap.stanford.edu/data/index.html
email jure at cs.stanford.edu

CAIDA AS Relationships Datasets
Dataset information

The dataset contains 122 CAIDA AS graphs, from January 2004 to November 2007 -
http://www.caida.org/data/active/as-relationships/ .  Each file contains a full
AS graph derived from a set of RouteViews BGP table snapshots.

Dataset statistics are calculated for the graph with the highest number of
nodes - dataset from November 5 2007.  Dataset statistics for graph with
highest number of nodes - 11 5 2007

Nodes   26475
Edges   106762
Nodes in largest WCC    26475 (1.000)
Edges in largest WCC    106762 (1.000)
Nodes in largest SCC    26475 (1.000)
Edges in largest SCC    106762 (1.000)
Average clustering coefficient  0.2082
Number of triangles     36365
Fraction of closed triangles    0.007319
Diameter (longest shortest path)    17
90-percentile effective diameter    4.6

Source (citation)

J. Leskovec, J. Kleinberg and C. Faloutsos. Graphs over Time: Densification
Laws, Shrinking Diameters and Possible Explanations. ACM SIGKDD International
Conference on Knowledge Discovery and Data Mining (KDD), 2005.

Files
File    Description
as-caida20071105.txt.gz     CAIDA AS graph from November 5 2007
as-caida.tar.gz     122 CAIDA AS graphs from January 2004 to November 2007


NOTE for UF Sparse Matrix Collection: these graphs are weighted.  In the
original SNAP data set, the edge weights are in the set {-1, 0, 1, 2}.  Note
that "0" is an edge weight.  This can be handled in the UF collection for the
primary sparse matrix in a Problem, but not when the matrices are in a sequence
in the Problem.aux MATLAB struct.  The entries with zero edge weight would
become lost.  To correct for this, the weights are modified by adding 2 to each
weight.  This preserves the structure of the original graphs, so that edges
with weight zero are not lost.  (A non-edge is not the same as an edge with
weight zero in this problem).

    old new weights:
    -1  1
    0   2
    1   3
    2   4

So to obtain the original weights, subtract 2 from each entry.

The primary sparse matrix for this problem is the as-caida20071105 matrix, or
Problem.aux.G{121}, the second-to-the-last graph in the sequence.

The nodes are uniform across all graphs in the sequence in the UF collection.
That is, nodes do not come and go.  A node that is "gone" simply has no edges.
This is to allow comparisons across each node in the graphs.
Problem.aux.nodenames gives the node numbers of the original problem.  So
row/column i in the matrix is always node number Problem.aux.nodenames(i) in
all the graphs.

Problem.aux.G{k} is the kth graph in the sequence.
Problem.aux.Gname(k,:) is the name of the kth graph.
|